UX Research & Design

Research that changes what gets built.

Five projects, spanning 2012 to 2022, with enough detail to actually talk about in an interview. Every image here is an artifact from the work itself.

SAP Ariba · Principal UX Researcher · AribaLive workshop, April 2016

Co-creating the industry's first Guided Buying experience with enterprise buyers

A two part workshop, storyboarding then card sorting, that turned customer instinct into the actual blueprint for Guided Buying.

The problem

SAP Ariba wanted a guided buying experience for people who buy things at work but aren't procurement professionals. Someone in Marketing ordering carpet cleaning, say. Rather than design it first and test it after, I ran a workshop to build it with the customers themselves.

How I ran it

First, storyboarding. We asked a room of customers to sketch their own ideal buying experience from scratch, one step at a time, before showing them anything of ours. No prompts from our designs, just what they pictured when they imagined the whole thing working the way it should.

Second, card sorting our early designs. In small teams, people took a set of screen cards we had prepared and physically arranged them on the wall into the flow that made sense to them. It told us less about which individual screens people liked and more about how they expected the experience to unfold from start to finish.

To keep the signal honest, we didn't let the loudest person in the room win. Everyone voted individually with happy face and sad face stickers on what worked and what didn't, then explained each vote on a sticky note before the group discussed the results together.
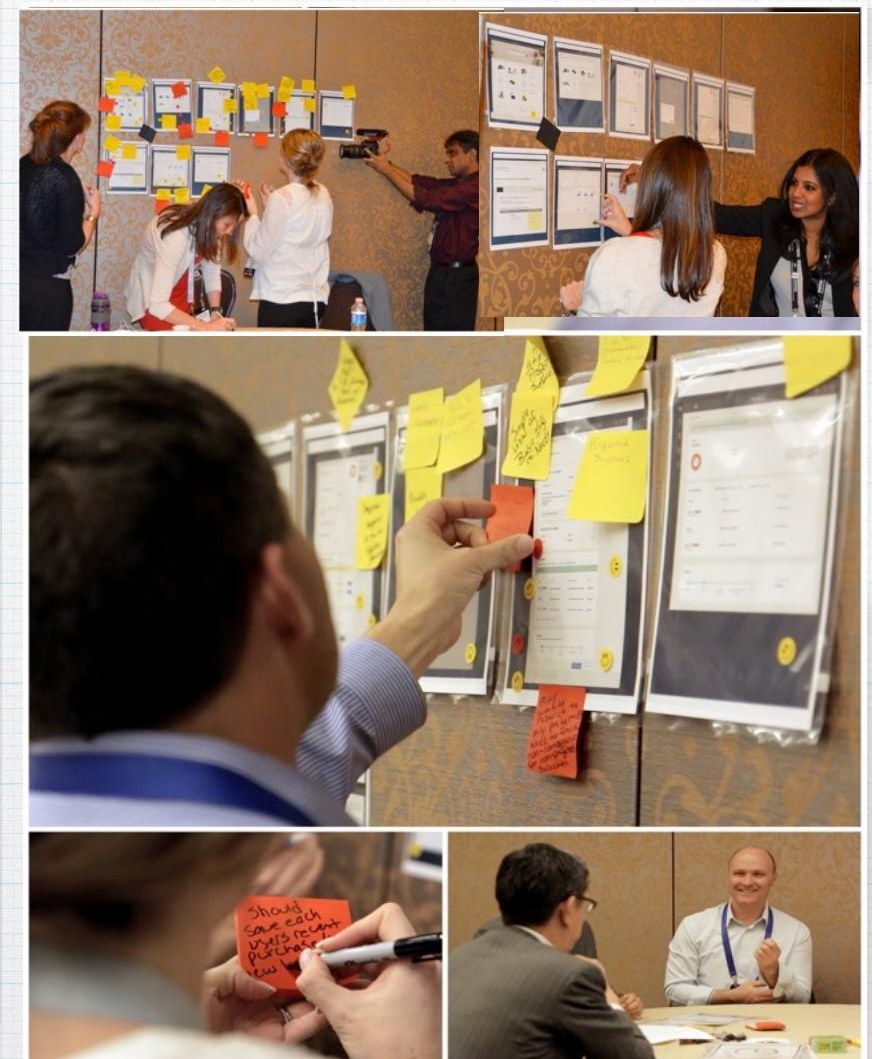
Workshop participants arranging printed screen mock-ups on a wall and annotating them with sticky notes
Participative design and card sorting at AribaLive: customers arranging screen posters into the flow they expected, then voting and explaining each vote.

What came back

It matched a lot of our thinking, and corrected some of it. People wanted the flow to feel conversational, not form heavy. They wanted help and the ability to loop in a colleague built into every step, not added later. And if we were going to point them toward preferred suppliers, we needed to let them go around that list too, as long as they could explain why.

3M+
North American subscribers within a year of launch
33%
Surge in new cloud bookings that year
Leader
Gartner procure-to-pay, top ease-of-use scores
SAP Ariba · Principal Product Manager, Self Service · Nov 2018 – Apr 2021

Turning a support bottleneck into a research problem, not a staffing one

I rebuilt SAP Ariba's self service experience around how people actually seek help, not how the org chart assumed they would.

The problem

Ariba was growing 30 percent year over year, and every new customer meant more support tickets. The instinct was to hire more support staff. I wanted to know first whether this was actually a capacity problem, or a findability problem.

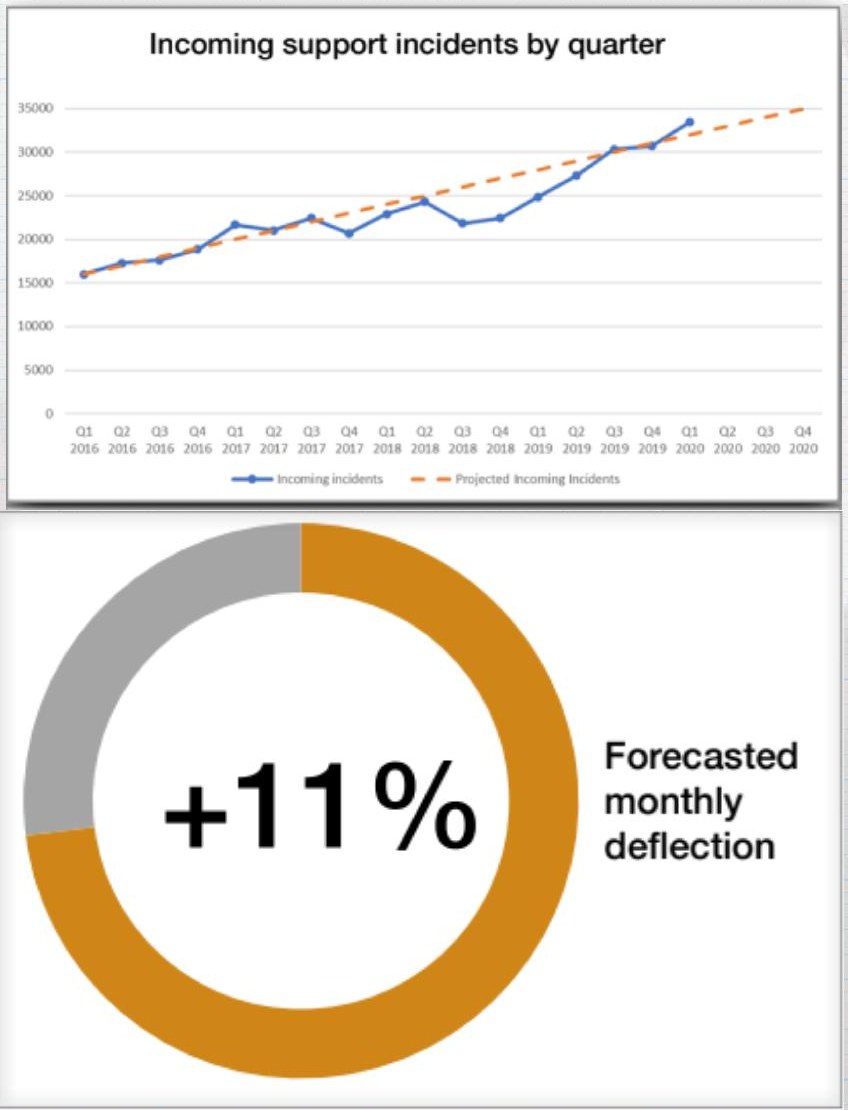
Line chart of incoming support incidents by quarter from 2016 to 2020, and a donut chart showing +11% forecasted monthly deflection
The trend that framed the work: incident volume climbing with growth, against an 11% forecasted monthly deflection target.

How I ran it

Three layers. A Qualtrics survey to external buyers and suppliers on how they look for help and where they get stuck. Workshops with twelve internal stakeholders across support, engineering, design, sales, marketing and customer success, to get everyone aligned before we built anything. And ten long interviews and remote contextual inquiries, watching people search for help in the moment instead of describing it after the fact.

What we heard

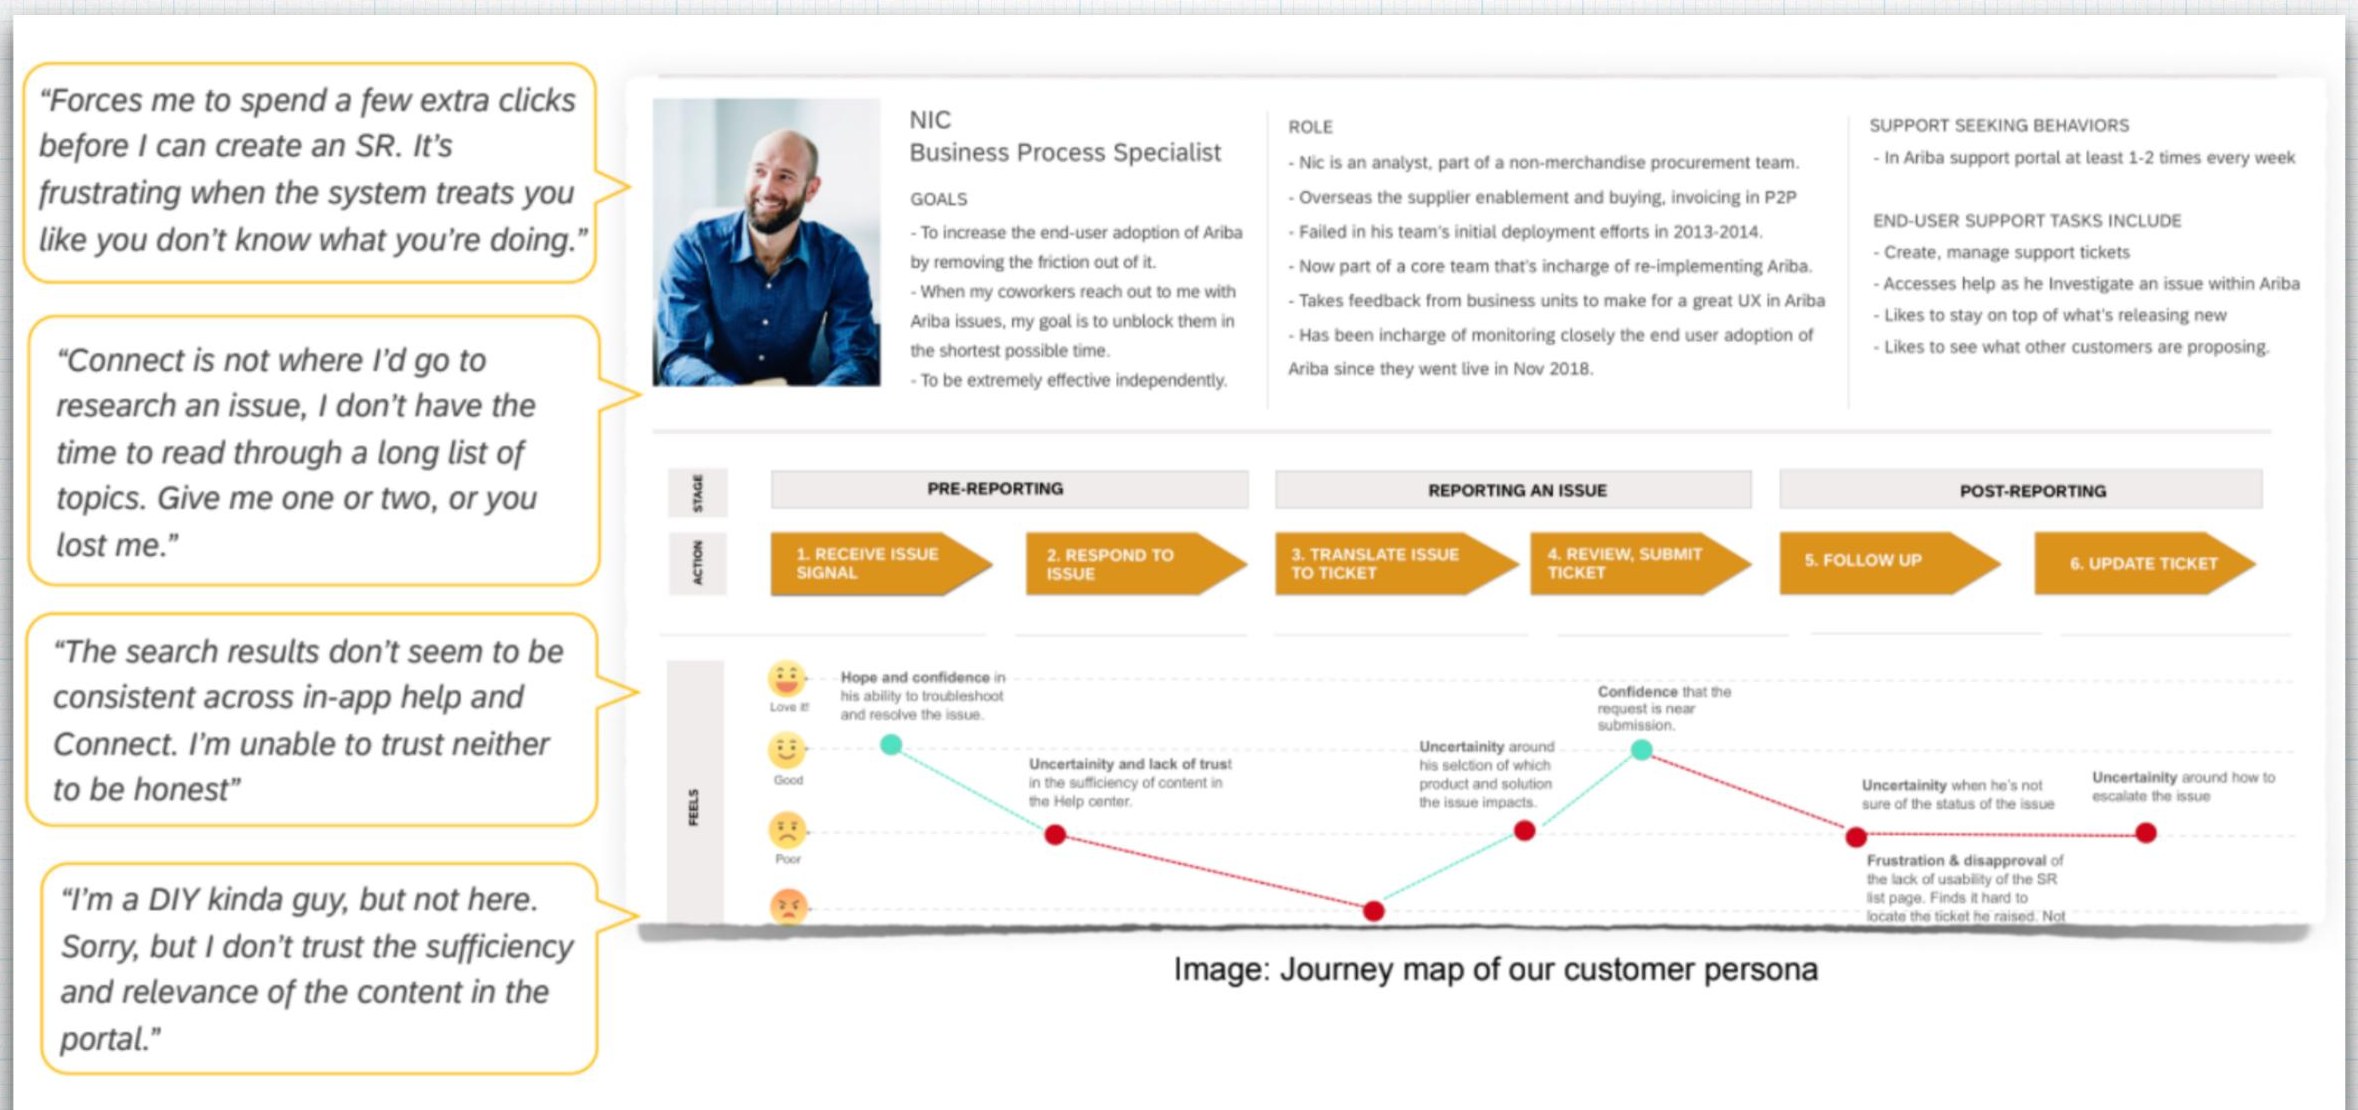
One persona stuck with me. Nic, a business process specialist who managed support tickets for his team, told me exactly how the product failed him.

“The search results don't seem to be consistent across in-app help and Connect. I'm unable to trust either to be honest.”

Nic, business process specialist
Customer persona sheet for Nic alongside a journey map tracking his confidence across pre-reporting, reporting and post-reporting stages
Nic's journey map, from noticing an issue to closing the ticket, with the verbatims that anchored each drop in confidence.

What changed

That distrust, more than any missing feature, was the real problem. We rebuilt the help experience around where his confidence actually dropped rather than where we assumed it would, and shipped in-product help that reached people at the moment they got stuck instead of after they filed a ticket. It freed the support team to spend their time on the harder cases instead of the findable ones.

~30%
Lower support cost across 2,900 Tier 1 accounts
+25%
Self service deflection
−50%
Incident volume

SAP Ariba · Principal UX Researcher · 2016 – 2018

Making Guided Buying usable by people the first version quietly excluded

The accessibility overhaul that turned a compliance blocker in the EU into new revenue there, and became SAP's internal benchmark for accessible design.

The problem

Guided Buying's lack of accessibility was stalling deals and go lives in the EU. Customers were escalating, and fixing it wasn't optional. I put together a team of developers and designers and worked directly with SAP's global accessibility testers and with customers who had motor and visual impairments, rather than auditing against a checklist on our own.

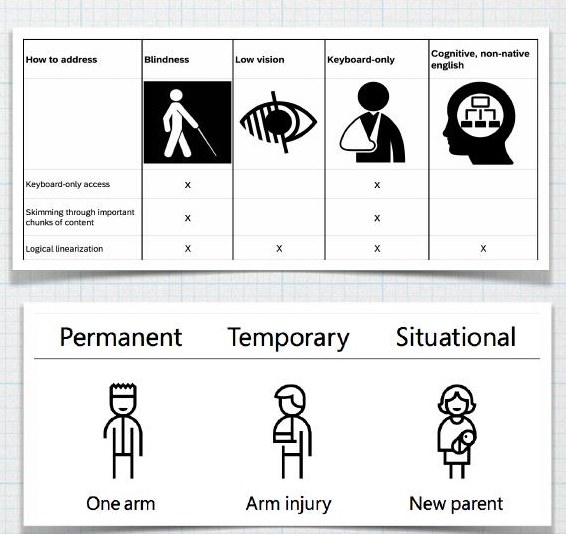
Two charts: barriers by user type (blindness, low vision, keyboard-only, cognitive) and the permanent, temporary, situational disability spectrum
How we framed who we were designing for: barriers mapped to how people actually access the product, permanent through situational.

What we found

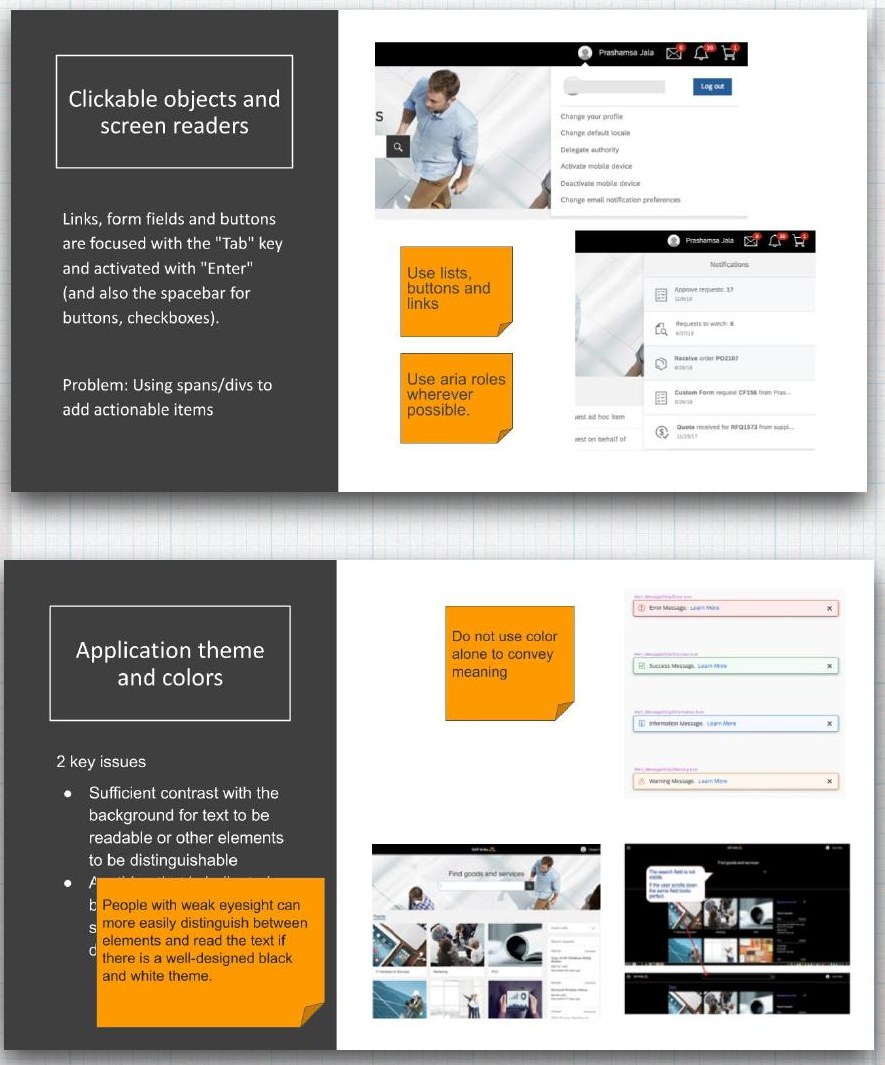
Some of it was obvious once someone actually tried to use the product with a screen reader or a keyboard only. Buttons and links were built as clickable divs instead of real interactive elements, so assistive technology never registered them. Color was used as the only signal for status, which fails for anyone with low vision or color blindness. Fixing it meant real interactive elements, keyboard first navigation, and never relying on color alone to carry meaning.

Annotated audit slides showing screen reader and clickable object issues, and application theme and color contrast issues
The annotated audit we worked from, with the two issue classes that mattered most: interactive semantics, and color as the only signal.
EU
Blocker turned into a selling point and new ARR
~15%
Of the global population newly able to use the product
Gold standard
SAP's internal benchmark for accessibility

Microsoft · UX Research Intern · Feb 2012 – Jul 2012

Learning how thumbs actually behave on a split tablet keyboard

Three linked studies, RITE testing, eye tracking, and a month of comparative testing, shaped the Windows 8 tablet keyboard that shipped.

The question

It sounds small. Does splitting a keyboard for thumb typing actually work. But Windows 8 was Microsoft's bet on tablets, and the keyboard was the thing people would touch the most.

Study 1: RITE testing

Four days, 12 participants, and I iterated the layout live between sessions as pain points came up. The clearest one was wasted space. The visual gap down the middle of the split felt awkward, even before anyone typed a word. That led us to try filling it with a number pad.

Study 2: Eye tracking

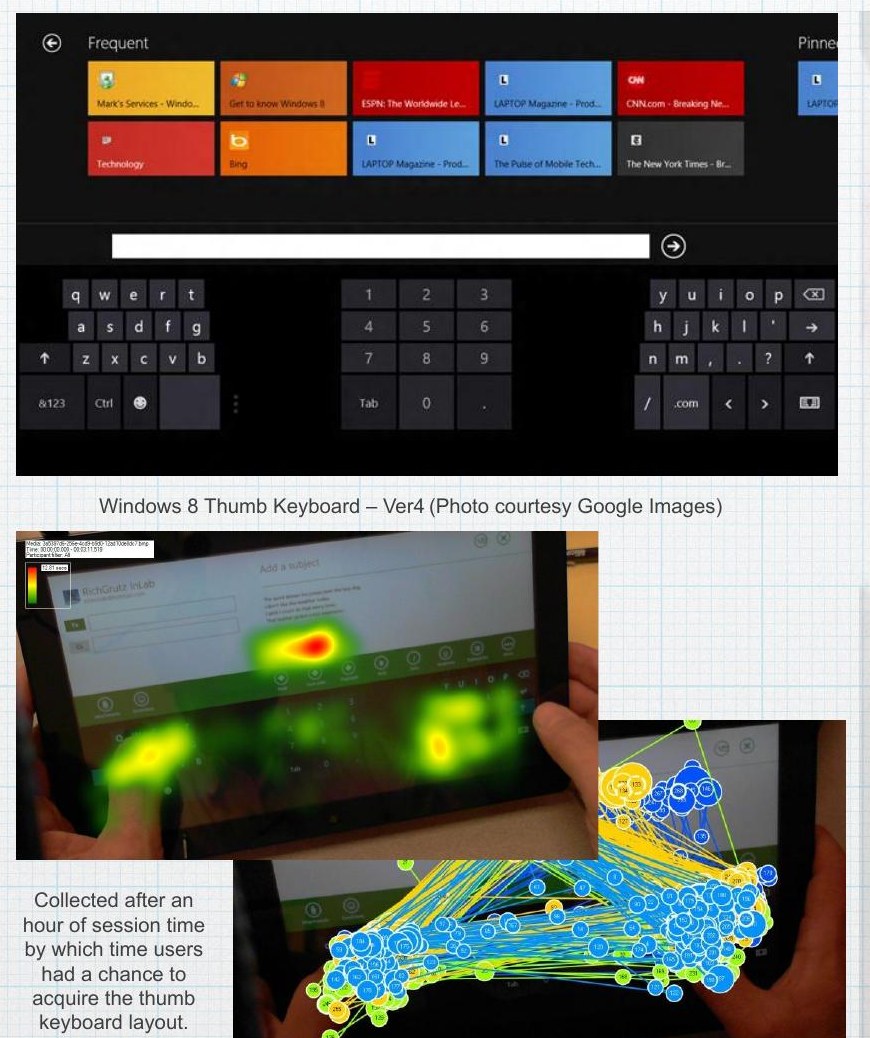
Was that number pad actually useful, or just visually reassuring? Eye tracking on 7 participants, after they had an hour to get used to the layout, gave a clean answer. It didn't help their typing at all, but it did ease the visual emptiness people had flagged. Two pieces of evidence pointing at two different truths, and both mattered for the design decision.

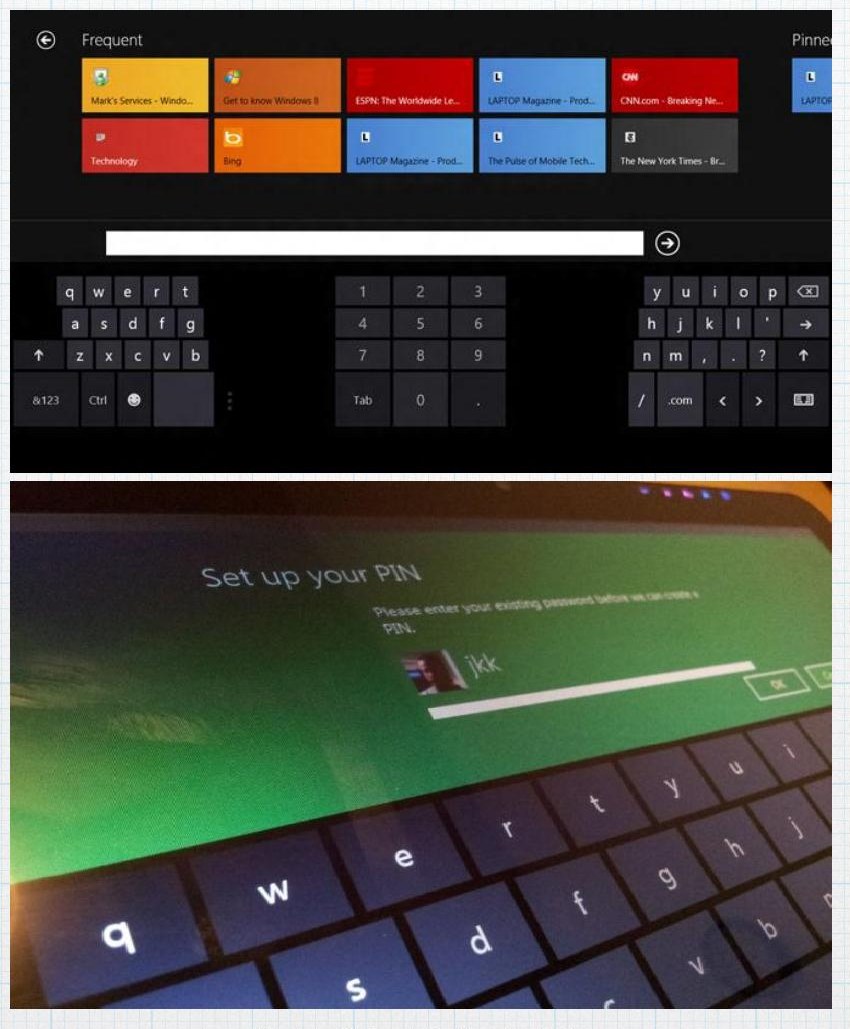
Windows 8 split thumb keyboard with a centre number pad, plus eye tracking heat map and gaze plot over a tablet held in two hands
Heat maps and gaze plots collected after an hour of practice, once participants had acquired the thumb keyboard layout.

Study 3: Longitudinal comparison

A month of comparative testing. 28 people, paired up, four consecutive days each, a 2×2 within-subjects design against the competing keyboard, counterbalanced so device order couldn't skew the results. That's where we saw how performance and confidence actually shifted over time, not just on day one.

The Windows 8 thumb keyboard layout and a close-up photo of a participant using a tablet keyboard
The shipped layout, and the setup participants used across four consecutive days.

One more thing

The eye tracking footage ended up as video highlights that marketing used almost immediately, a good reminder that research output isn't only for the product team.

Whatfix · Director, Head of Vertical Products · Apr 2021 – Apr 2022

Finding the vertical worth building, then building it from nothing

As Whatfix's first vertical product hire, I picked the vertical, ran the discovery, and helped make Whatfix the first company in its category named a 2022 leader on vertical focus.

The problem

Whatfix was a horizontal platform trying to grow past being a mile wide and an inch deep. I came in as the company's first vertical product hire, reporting directly to the founder and CTO, while the company moved from Series C to Series D. My job was to pick one vertical, prove it out, and build the playbook for the next ones.

The discovery

I ran internal and external discovery to find the customer profile with the most urgent need, and landed on P&C insurance claims teams. From there it was long interviews with claims professionals to understand what actually slowed them down. Training new hires, staying current on shifting regulation, getting accurate intake data the first time. I built the product, Whatfix Smart P&C, directly around that, working with 12 of the top 25 US insurers to shape it.

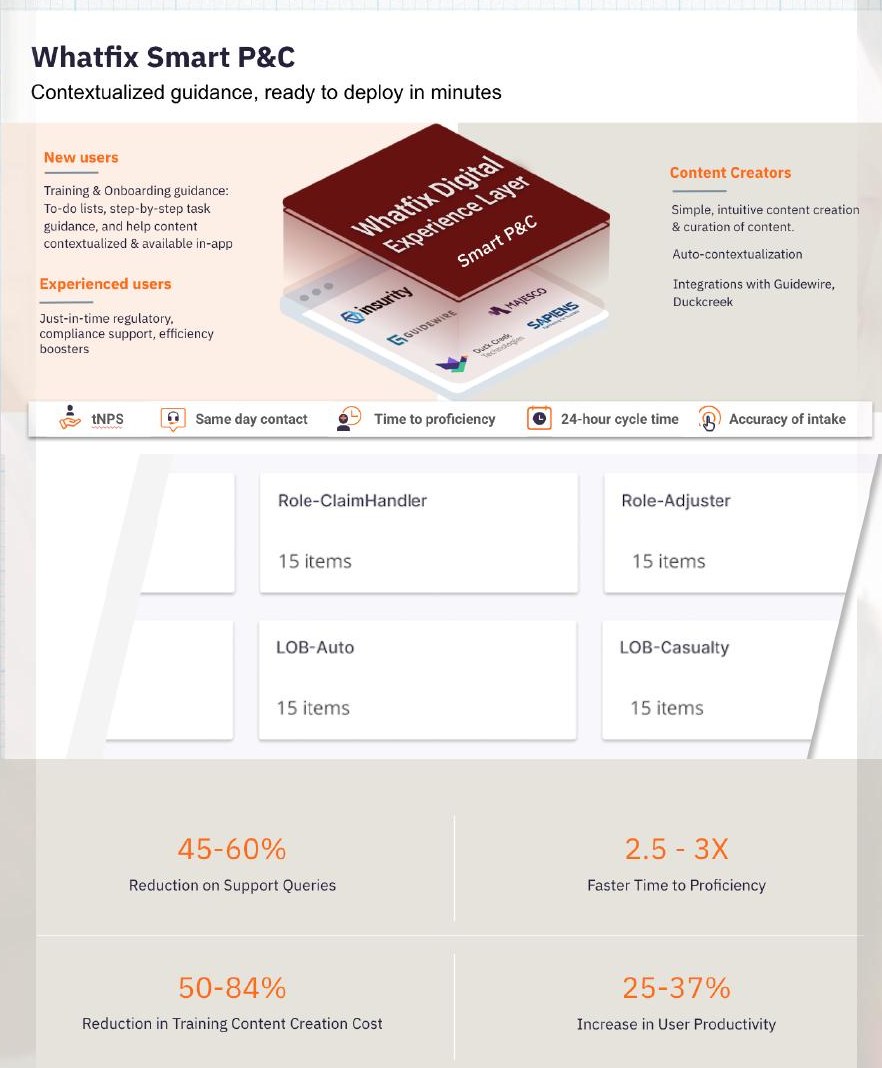
Whatfix Smart P&C product overview showing role and line-of-business content packs and outcome metrics
Whatfix Smart P&C: role and line-of-business content built from the claims interviews, with the outcome metrics we committed to.

Getting it in front of insurers

Half the job. It meant going through the systems they already ran on, not asking them to add another tool. I opened the line's first ISV integrations into Guidewire, Duck Creek, and Majesco, along with SI partnerships with Accenture and LTI, then briefed the analysts and trained sales to carry the story themselves.

45–60%
Drop in support queries
2.5–3×
Faster time to proficiency for new hires
25–37%
Lift in user productivity

Also worth mentioning

Usability research and RITE testing on early desktop deposit mockups at Wells Fargo, 2012. And fifteen years of the connective tissue in between: cognitive walkthroughs, card sorting, journey mapping, statistical analysis, and a lot of just sitting with people while they try to do something and get stuck.